BSU Journal Club
Jupiter’s moon Io has long been famous for its sky-splitting volcanic eruptions, powered by Jupiter’s tidal gravity. But strange ridge-like features in regions adjacent to the volcanoes have raised questions since their discovery — What are they? How are they formed? Are they somehow related to the volcanoes? A recent study has argued that, even under Io’s whisper-thin atmosphere, these ridges are probably vast dune fields. This new discovery adds yet another world to our growing trove of worlds where aeolian processes operate.

White dwarf stars have been a mystery since they were first discovered. Extraordinarily hot and compact, the engima of white dwarfs was unraveled largely through the herculean efforts of the Harvard computers. Astronomers now know white dwarfs are the final stage of a violent aging process for Sun-like stars. And though astronomers originally expected such violence would spell doom for any planets in orbit, mounting discoveries show that some planets at least can survive this cataclysmic descent into stellar senescence. Whether any life survives on those planets is another matter.
Continue Reading
Contrary to popular opinion, there are NOT 525,600 minutes in a year. That’s because the Earth takes more than 365 days to circle the Sun and come back to the same place (although defining “the same place” is non-trivial). Modern calendar systems assume 365.2422 days in a year, which works out to 525,948.768 minutes — it doesn’t quite roll off the tongue the same way, but it does give you almost 349 more seasons of love.
But that’s just for Earth. If you lived on one of the most recently discovered exoplanets, you would have fewer than a thousand love seasons. That’s because this planet, the ultra-hot Jupiter TOI-2109 b, circles its star once every 16 hours. But the fate of TOI-2109 b-ian lovers is sealed not just by their short seasons but because their planet is doomed, a sad destiny foretold by a French physicist who saw his own world rent to pieces.
Continue Reading
From a sandy spit in Florida, an ear-shattering rumble followed by a sky-splitting streak of light heralded the launch of NASA’s Lucy mission, a twelve-year effort to explore sky-borne fossils. The mission began its journey to visit seven asteroids, with orbits stretching from Mars to Jupiter.
Like artifacts from someone’s childhood, Lucy’s targets will help unravel the rich and complex story of the Solar System’s earliest days. But these targets promise an even deeper glimpse than before because of exactly where they orbit. These asteroids have been trapped for billions of years in a spiderweb woven from gravity, the subtle strands of which were teased apart in 1770s Prussia by the Franco-Italian heir to Newton’s legacy.
Continue Reading
Hosting a sub-surface ocean, Jupiter’s moon Europa is one of the most compelling targets for planetary exploration in the Solar System. Probing the moon’s geology, sub-surface ocean, and the possibility for life are the foci of NASA’s upcoming Europa Clipper mission, set for launch in 2024.
While we wait for that mission, scientists keep chipping away at the Europan enigma using data from telescopic observations and from previous missions, particularly the Galileo mission. For example, Hubble observations suggest Europa has active geysers.
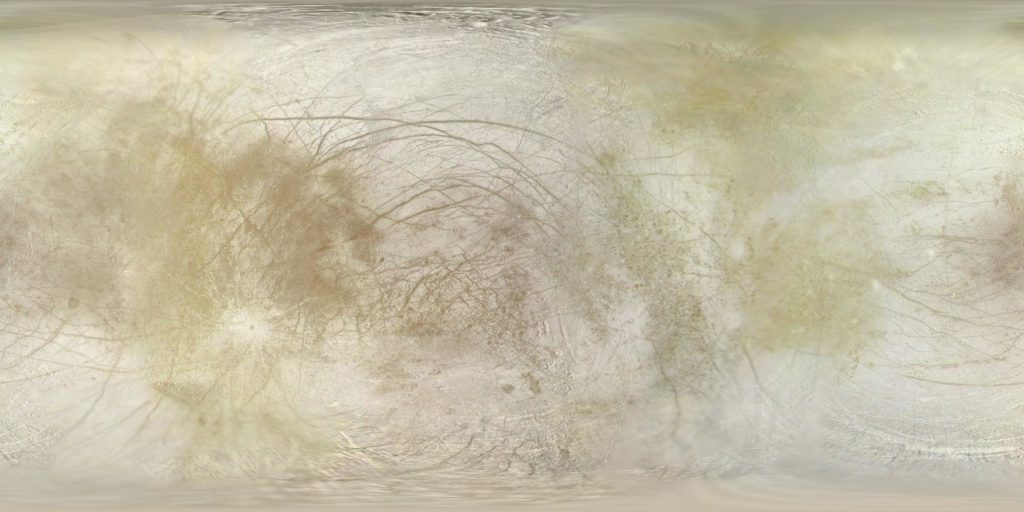
The Two Faces of Europa
One of the longest standing mysteries of Europa is the origin of its so-called hemispheric dichotomy. In short, as Europa revolves around Jupiter, it keeps one face always pointed toward the planet in a rotation state called “synchronous rotation”. (Earth’s own moon does the same thing.)
Ninety degrees to one side of the Jupiter-facing hemisphere is the leading hemisphere, the half of Europa that points in the direction of its orbital motion. The opposite side is the trailing hemisphere, which faces Europa’s past orbital location.
Perhaps counter-intuitively, Europa’s trailing hemisphere bears the fury of Jupiter’s magnetic field and radiation belts. Because Jupiter rotates so more quickly than Europa orbits (one rotation every 10 hours vs. 3.5 days for Europa’s orbit), charged solar wind particles trapped in the magnetic field are continually hurled at Europa’s trailing hemisphere. This constant sputtering chemically darkens the surface ice on the trailing hemisphere and likely explains the dichotomy.
This explanation makes one big assumption: that Europa has been tidally locked forever, or at least long enough that evidence for a different rotation state has been wiped away. Indeed, the rotation rate directly measured from Voyager and Galileo Missions images agrees completely is exactly what you’d expect for a tidally locked satellite.
But those constraints also allow for a tiny amount of non-synchronicity, perhaps allowing a reversal of the leading and trailing hemispheres every 6,000 years. That’s good because non-sychronous rotation seems to be required to explain one of the most dramatic geological formations on Europa.
Under (Tidal) Pressure
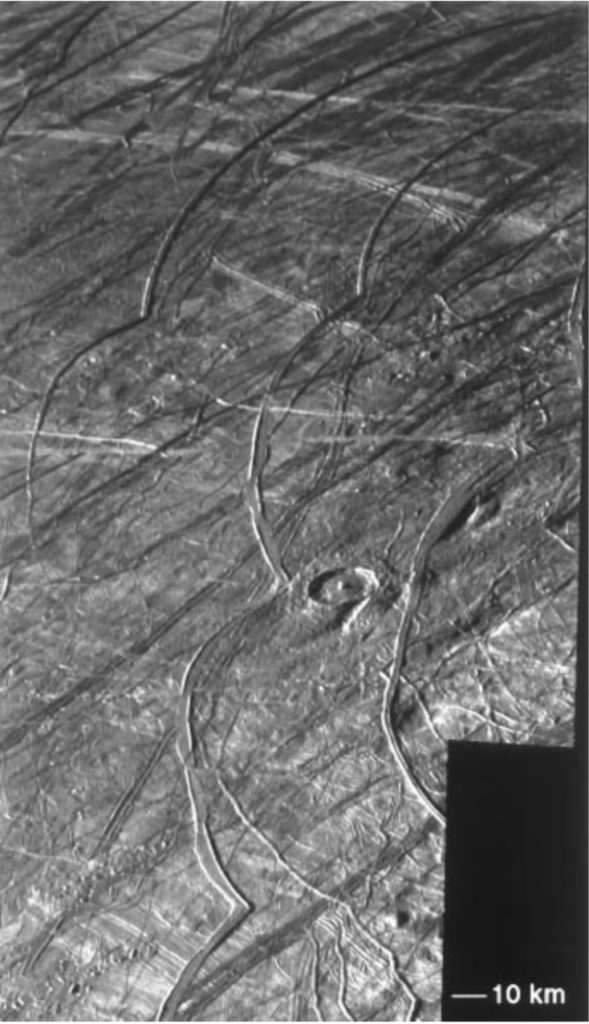
Geophysical scars mar Europa’s surface at almost all scales, from global to regional. The rifts and valleys that cross Europa, in many cases, arise from tidal stresses induced by Jupiter’s enormous gravity: as Europa circles Jupiter, the planet’s gravity stretches and compresses the satellite.
This tidal flexure can crack and rip Europa’s brittle icy shell, and the resulting rifts propagate across the surface in arcuate tracks that follow the maximum tidal stresses. In turn, the combination of Europa’s orbital motion and its rotation determine the path of maximum tidal stress across the surface.
Given that the tidal rifts form over the course of millennia, we can, in principle, use their shapes and orientations to infer Europa’s past rotation state. And analyses of the locations and orientations of cycloids implicate some non-synchronous rotation in Europa’s past.
In that case, then, we might expect the hemispheric dichotomy not to be so dichotomous — the darkening ought to extend a little ways across the boundary between the leading and trailing hemispheres. So does it?
Flummoxed by Fourier
The short answer seems to be “no”. A recent study by Burnett and Hayne of UC Boulder analyzed the contrast between the two hemispheres in ultra-violet and infrared wavelengths to enhance the contrast.
For their study, Burnett and Hayne used a technique called Fourier analysis. It turns that any oscillating pattern — electrical signals, photographs, ocean waves — can be broken down into lots of smaller oscillating signals, each with completely regular periods, as shown in the video below.
The benefit of breaking a complicated signal into lots of small regular ones is that you can then analyze each of them individually to learn about how the big picture signal arises.
In their study, Burnett and Hayne broke down Europa’s hemispheric dichotomy into two oscillating pieces: one piece that oscillated as if Europa’s rotation has always (or at least for a long time) been synchronous and another piece for any non-synchronous rotation. The figure below shows the result of their analysis.
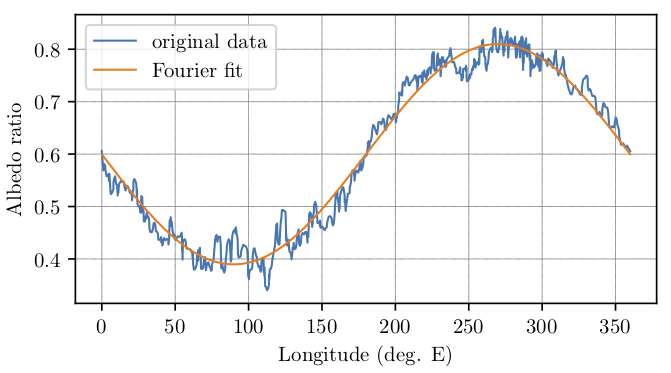
They found that the Fourier term for non-synchronous rotation was much smaller than the term involving only synchronous rotation, meaning that any non-sychronous rotation must have been very small.
How small? Estimating the rate of non-synchronous rotation requires have some feature on Europa’s surface whose age is known. Thankfully, a cosmic collision provides one such feature.
Puzzled by Pwyll
Europa’s surface is geologically very young, probably less than 200 million years old. We can tell that because, unlike Earth’s moon, the surface of this moon is almost bereft of impact craters: the older a solid surface is geologically, the more asteroids and comets have left their marks on the surface.
If a planet or satellite experiences wide-spread volcanism or other geological activity, that can cover up any impact craters. Indeed, there is evidence that Europa’s sub-surface ocean periodically breaks through the icy crust, potentially erasing impact craters and renewing the surface.

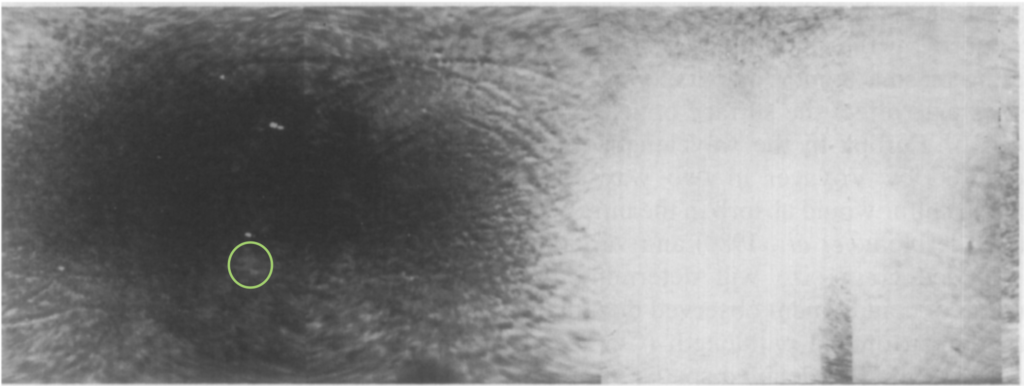
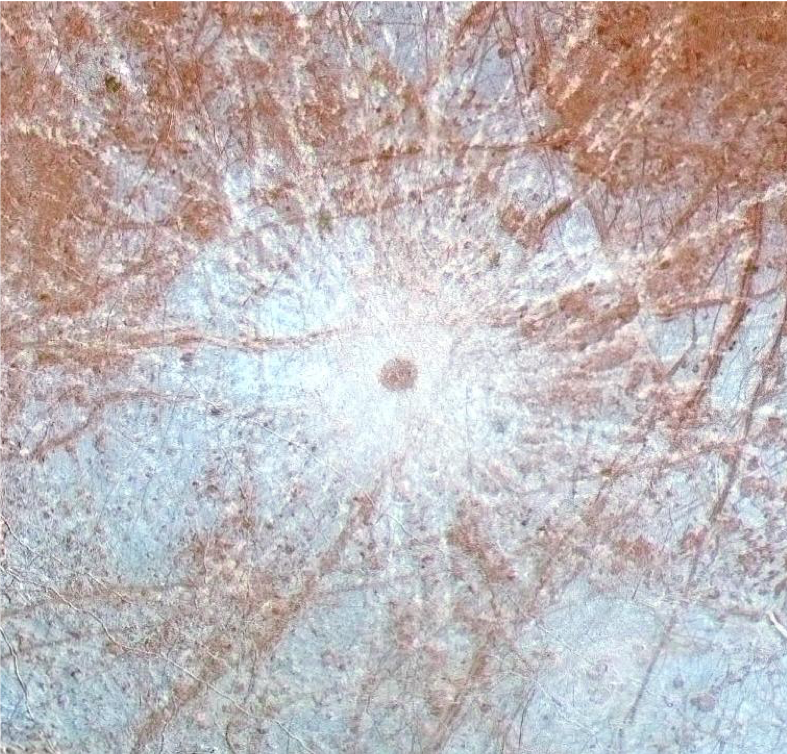
However, Europa does host a few craters and few so spectacular as Pwyll, a 40-km icy splat mark smack in the middle of Europa’s trailing hemisphere. Pwyll’s bright impact rays contrast vividly against the splotchy trailing hemisphere. That means the sputtering process which darkens the rest of the hemisphere hasn’t completely obscured Pwyll yet.
In their study, Burnett and Hayne estimate that Pywll is about 1 million years old, a geological newborn, and therefore the darkening process must take at least 1 million years to darken a fresh surface on Europa.
Given how small the non-synchronous Fourier term is, this age estimate translates into a non-sychronous rotation period of almost 1 billion years. In other words, the two hemispheres can’t reverse more often than once every 500 million years — a very long time.
So how to reconcile this result with the apparent requirement for non-synchronous rotation from the cycloidal analysis? Burnett and Hayne can only shrug and say it’s a puzzle.
We’ll just have to send a probe to Europa to find out.
There were lots of great things about the movie “The Martian” (and a few inaccurate things), but one of the best things, for aeolian scientists like myself anyway, was the depiction of ubiquitous, enormous dust devils.
Mars loves to make dust devils. It’s relatively easy for sunlight to heat the atmosphere and get it churning, and thick dust deposits blanket enormous regions on Mars.
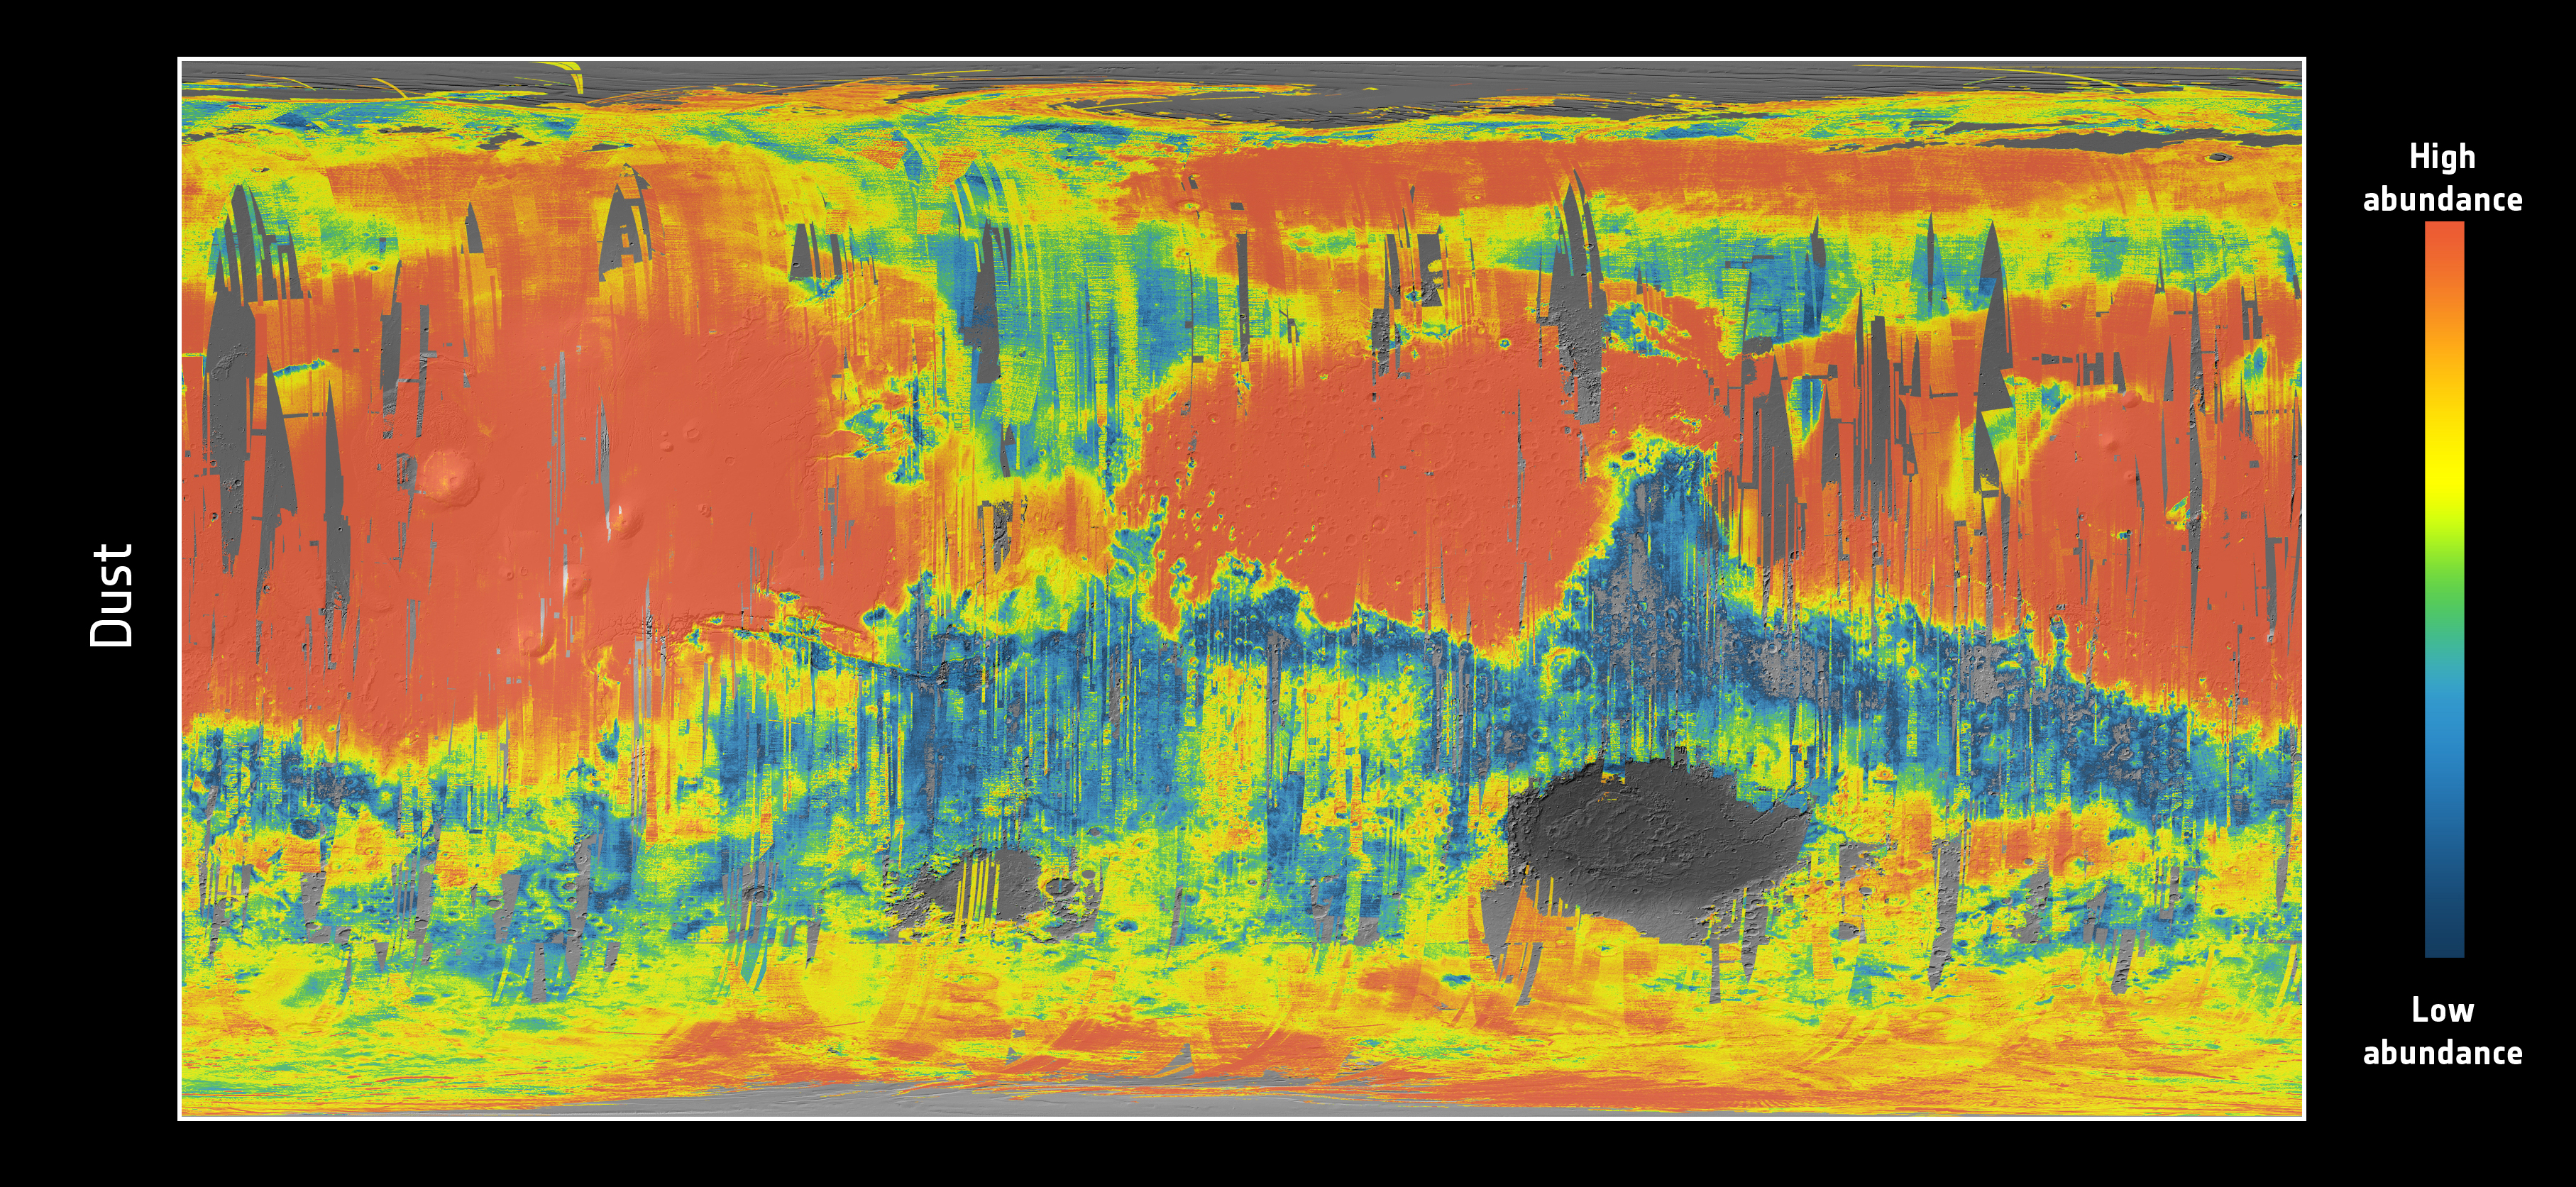
Dust devils on Mars help keep the atmosphere dusty, which warms the climate and helps drive weather. However, as surprising as it might be, we don’t totally understand how dust devils actually lift dust.
Sure it’s true that dust devils are windy, but when you actually plug the windspeeds measured in dust devils into the dust-lifting equations, the amount of dust they *should* lift can be much less than what they *do* lift. So some other mechanism besides just wind must help lift dust in devils.

One possibility is that dust devils act like vacuum cleaners and actually suck dust up off the martian surface. See, a lot of the dust sitting on the surface of Mars has been sitting there for a long time, not moving. As a result, the dusty surface can become vacuum-packed, trapping some gas in between the dust grains.
At the center of a dust devil is a small dip in the atmospheric pressure (created by the convecting air inside the dust devil). So when a dust devil skitters over the hermetically sealed dust surface, the trapped gas pressure can launch the dust into the air, where the devil can pick it up.
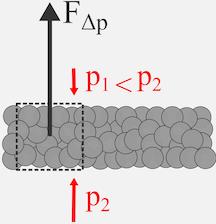
But this vacuum cleaner effect is still just a hypothesis, so to test this idea, the Experimental Astrophysics group at University of Duisburg-Essen, experts in astrophysical dust experiments, set up a test chamber to mimic the martian surface under a low-pressure (1% of Earth’s) martian atmosphere.
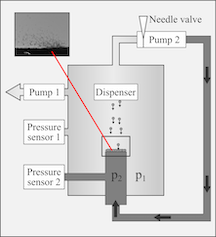
They created a thin layer of small dust grains on a membrane, with a pressure differential across the membrane, to see if a small pressure differential could really lift the dust grains up. The answer is yes!

Now whether this experiment accurately replicates conditions on Mars is not totally clear, but some of the measurements made by the soon-to-be-launched and recently named Mars 2020 rover Perseverance may help to test the idea.
In addition to collecting geological samples for later return to Earth, Perseverance will collect high-resolution imagery of dust and mineral grains on the surface of Mars. It will also continuously measure meteorological conditions, which we know from past missions can reveal the presence of dust devils. So in addition to telling us about the possibility of past life on Mars, Perseverance may also help us test whether there are dust devil vacuum cleaners on Mars.
Professional astronomers spend a lot of time on reading other astronomers’ research to learn what’s going on in the field and to incorporate new, best results into their work.
Traditionally, that research is officially presented to the astronomical community in the form of a peer-reviewed article printed (or at least hosted) in a professional astronomical journal, such as “The Astrophysical Journal“, “The Astronomical Journal“, or the venerable “Monthly Notices of the Royal Astronomical Society“.
However, scientific research articles are very unlike newspaper or magazine articles — they don’t usually employ a narrative structure, and they include confusing words and references. Consequently, it can be hard for people new to the field to read and understand them.
So in response to insightful requests from my students, here’s a short primer about how to read astronomical research articles. A lot of this information probably applies to all scientific articles, but there are also some aspects unique to astronomical articles. If you have suggestions to improve this post, don’t hesitate to contact me.
Continue Readinghttps://arxiv.org/abs/1910.09523
https://en.wikipedia.org/wiki/Kelvin_wave