As part of my new push into data science, I read Shi & Malik’s paper on the perceptual grouping problem in which they develop a new algorithm for dividing an image up into coherent regions.
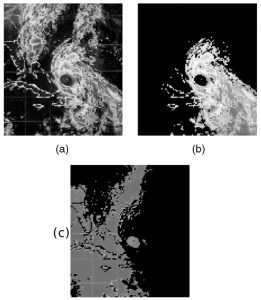
What does it mean to divide an image into coherent regions? Say, for example, you had a satellite image of a large storm system, such as the figure at left from Shi and Malik’s paper. Panel (a) shows the original image, while (b) and (c) show two portions of the image grouped together by Shi and Malik’s algorithm. The result makes intuitive sense (at least, to me): (b) is a large part of the storm, while (c) is the ground underneath.
Basically, Shi and Malik’s algorithm treats the entire image as a weighted graph, with portions of the image treated as nodes. Weights on the edges connecting the nodes are larger for portions that are closer to each other and for portions that are similar (where similarity may depend on the pixel brightnesses, textures, colors, etc.).
The algorithm decides which portions belong together as one segment using the weights for all the nodes connected in that segment. Shi and Malik developed a clever way to turn this process into an eigenvalue/vector problem, thereby dramatically facilitating the calculation. Their technique amounts to treating the pixels as individual masses connected by springs, with spring constants given by the edge weights, and then finding the normal modes of oscillation for the system: pixels that are strongly coupled are grouped together as one segment.
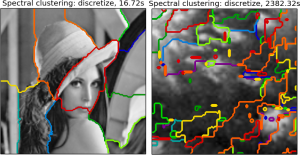
Conveniently, the algorithm is implemented in the scikit-learn python module. Using their example code, I was able to reproduce the segmentation of the Lena image easily (shown below), so I thought to try it on some VIMS observations of Titan. (Here’s the original Titan image. I took a small portion of it.)
Unfortunately, the result was not promising: the algorithm did NOT break up the image into the segments I expected. Instead, the segments seem pretty random. It also took about 40 minutes to work, even though the Titan image is smaller than the Lena image (100 x 100 pixels vs. 128 x 128).

(Left) Result from the spectral clustering example code on the scikit-learn page. (Right) My own attempt at segmenting a VIMS image of Titan.
Next things to try: it seems the algorithm needs me to tell it how many regions to use — I used the number given in the original example, 11. Maybe I should try a smaller number. There are also a few options as to how the graph weight are calculated in the original Shi and Malik algorithm (not sure if the scikit-learn module has that capability).
