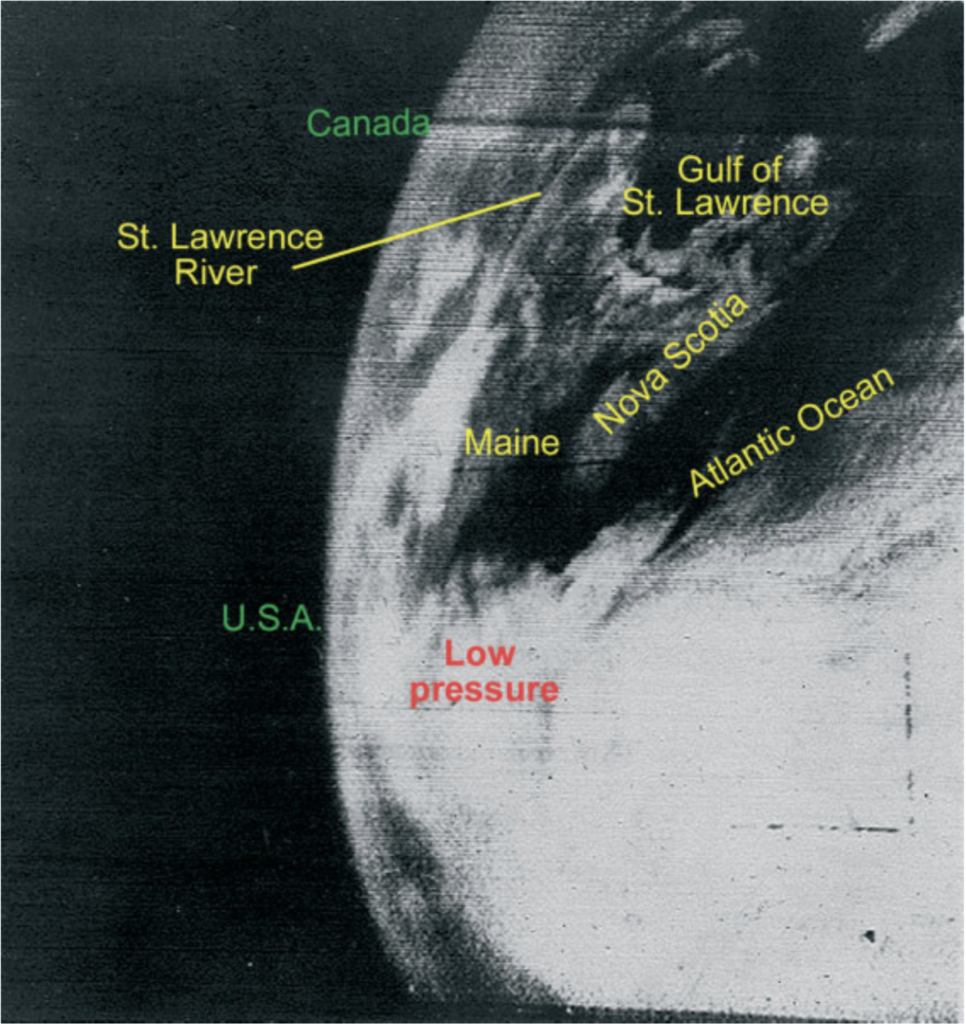
On April 1, 1960, NASA took the first weather satellite picture onboard TIROS-1, the Television and Infra-Red Observation Satellite.
In spite of its name, TIROS-1 could only collect images in visible wavelengths, but over its nearly two-month mission, it collected more than 20,000 images of weather systems from an altitude of 700 km, launching the ancient science of meteorology into the space age.
Since those early successes, scientists have found a bewildering variety of weather patterns across the solar system.
For instance, on Venus, a stratospheric jet stream jet stream on steroids herds clouds around the planet every four days, even though it takes almost a year (243 days) for the solid body of Venus to rotate once on its axis (the Earth only takes 24 hours).
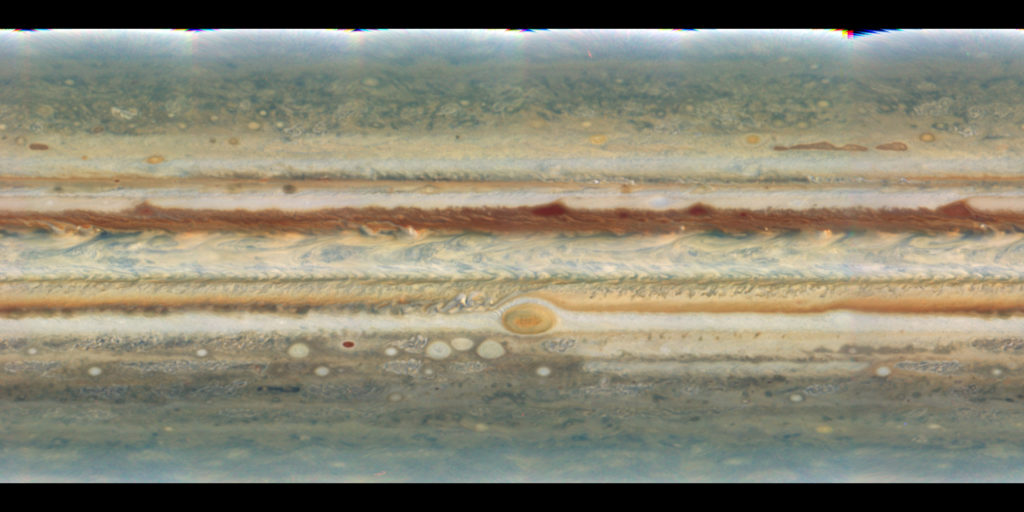
A much faster rotator, Jupiter also exhibits jet streams, and, as seems fitting for the largest planet in the solar system, the jet streams are so massive they induce a measurable gravitational signature recently detected by NASA’s Juno mission currently orbiting the king of planets.
We’ve even managed to extend our meteorological studies beyond the solar system. In 2007, Heather Knutson and colleagues used soon-to-be-decommissioned Spitzer Space Telescope to create a low-res map of the atmosphere of the hot gas giant HD189733b in infrared wavelengths.
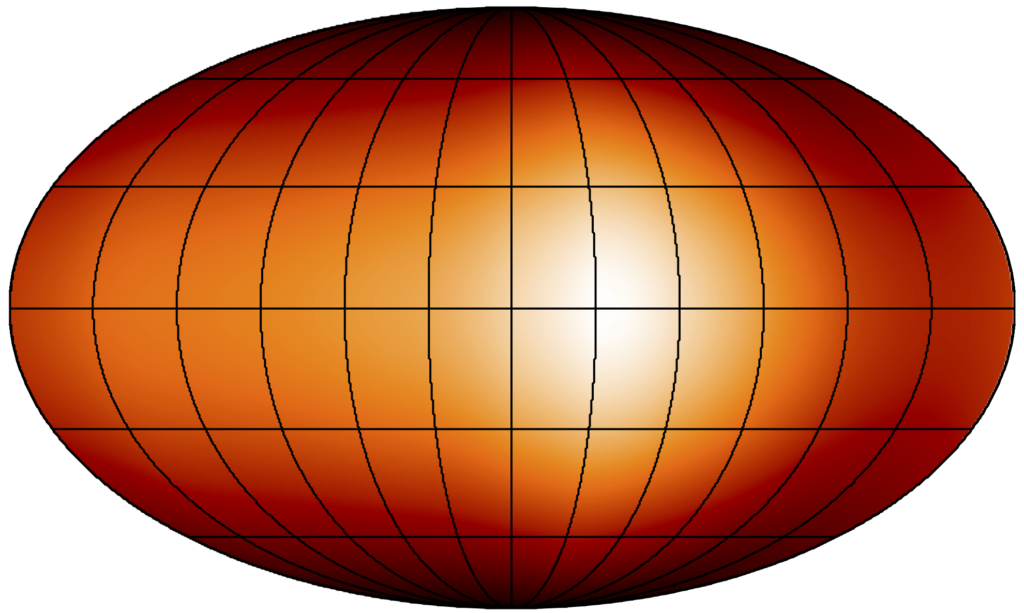
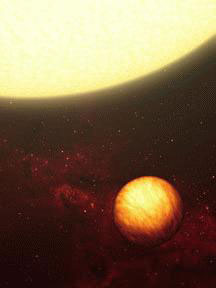
Unlike planets in our own solar system, we can’t directly image HD189733b — it’s too far away. So Knutson and colleagues used a trick to map HD189733b. Since the planet orbits very close to its host star (it circles the star once every 2 days), tidal interaction with the star has probably locked the planet’s dayside to always face the star and the nightside to always face away (reminiscent of the Moon’s rotation).
Knutson and colleagues created their map by simply watching HD189 circle its host star, and as the bright dayside rotated in and out of view, they watched as the amount of light from the planet went up and down. This up and down, called a planetary phase curve, allowed them to decipher which regions on the planet were brighter than others.
And what they found was a little surprising. Even though the planet’s dayside always points toward the star, the hottest place in the planet’s atmosphere wasn’t the place that receives the most sunlight (the “sub-stellar point“) — it was about 3,500 km to the east. Why?
Since HD189 is tidally locked, the dayside is MUCH hotter than the nightside, and this very large temperature contrast drives a super-rotating jet. This jet carries gas through the sub-stellar point at thousands of miles per hour, and by the time the gas has a chance to heat up, it’s already thousands of miles downwind.
But even though jet streams like this can be permanent features in a planet’s atmosphere, they are highly dynamic. For instance, the periodic appearance over the midwestern US of polar vortices result from meanders in the Earth’s jet stream. Since jet streams on hot Jupiters are driven by thousand-mile-an-hour winds, we might expect even more dramatic variability.
Cued by these expectations of jumpy jet streams, our research group studied the planet Kepler-76b, a Jupiter-sized planet zipping around its host star every 1.5 days. The planet is so close to its star that it’s as hot (2200 K or 3500 degrees F) as some low-mass stars.
We analyzed phase curve observations of Kepler-76b collected several years ago by the Kepler Mission, which stared at the planetary system for more than 3 years, which gave us a lot of data to work with.
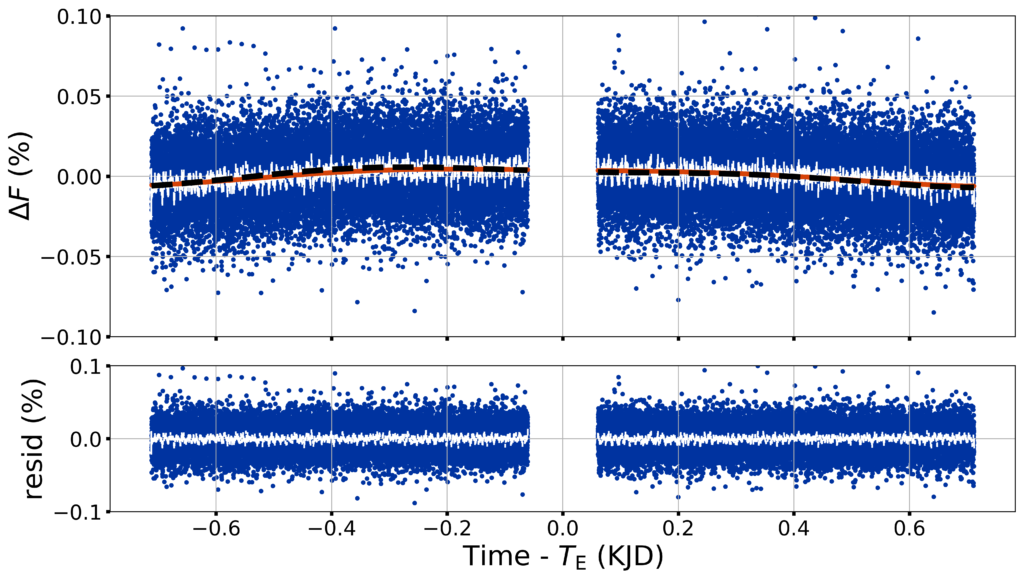
The blue dots in the figure above shows the subtle up-and-down phase curve for Kepler-76b. In our analysis, we found that up-and-down went up a lot during some orbits and much less on others. All told, these variations amounted to changes in the planet’s dayside temperature of hundreds of degrees.
What’s causing this variability? The short answer is we don’t know. But we have some guesses. Previous work has shown that, although Kepler-76b’s dayside is much too hot for clouds (they quickly vaporize), the super-rotation can transport clouds from the nightside.
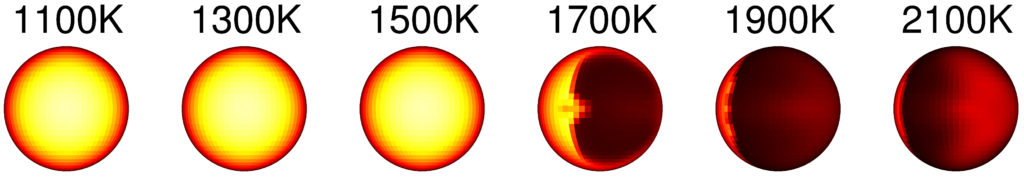
We expect that when Kepler-76b’s dayside gets a little cloudy, it will get a little brighter, meaning the phase curve will have more up and down. But since the dayside clouds would now be reflecting more sunlight, that means the dayside will get a little cooler (like on a cloudy day on Earth).
Since the windspeed of the jet stream depends on the temperature contrast between the day and nightsides, a cooler dayside presumably means a weaker jet. The clouds transported to the dayside then evaporate, and the weaker jet cannot bring clouds from the nightside quickly enough to resupply them. Thus, the clouds clear out, the dayside loses its cooling shroud and heats up, which strengthens the jet and starts the cycle all over again.
As in all things science, more studies are needed to decide whether this scenario actually plays out in the atmosphere of Kepler-76b and other hot Jupiter. But for now, studies like ours show that the same kinds of meteorological processes seen on the Earth from space 60 years ago can also be seen on worlds beyond our solar system.