Archives

All posts for the month April, 2015

With the help of physics major Jared Hand, we’ve started a weekly meeting group here in physics to discuss scientific computing — the Boise State SciComp Workshomp.

The meetings take place in the physics building, room MP408, and will focus on the nitty gritty of scientific computing — how to install and run various codes and packages.

We’ve started a github repository for the group: https://github.com/decaelus/BoiseState_SciComp_Workshomp.

We will keep a log of our meetings on the associated wiki: https://github.com/decaelus/BoiseState_SciComp_Workshomp/wiki/Working-with-Git.

We’re currently working through a presentation from the Software Carpentry Foundation on using git: http://slides.com/abostroem/local_version_control#.

At journal club today, we talked about a study from Heller and Pudritz that looks at the formation of moons around gas giant planets in extrasolar systems.

Heller and Pudritz modeled the conditions in circumplanetary disks around Jupiter-like planets to find where temperatures are right for icy moons like Jupiter’s to form. Like Goldilocks, moon formation requires conditions that are juuust right: the planet can’t be too close to its star or too small.

But given the right conditions, moons will happily accrete around a gas giant and the most massive circumplanetary disks around super-Jovian planets can form moons the size of Mars.

Heller and Pudritz point out that this means if we find an icy moon around one of the many gas giant exoplanets orbiting at about 1 AU from their host stars, we can infer the planet didn’t form there. Instead, it must have formed farther out and migrated in.

And at 1 AU around a Sun- like star, the discovery of such an exomoon would naturally make it a high priority target for habitability studies.

Attendees at today’s journal club included Nathan Grigsby, Jared Hand, Catherine Hartman, Emily Jensen, Liz Kandziolka, and Jacob Sabin.

Found some beautiful basalt columns around Lucky Peak State Park just east of Boise. A quick google search doesn’t turn up any previous surveys, so these could make a good spot for some follow-on studies to our field work back in 2011.

github-octocatHad our first Scientific Computing Discussion group meeting on Friday at noon. These meetings are intended to familiarize our students with scientific computing applications and how to manage and maintain various science computing modules. We started a github repository where we’ll post notes and other information: https://github.com/decaelus/BoiseState_PAC_Workshop.

Attendees included Liz Kandziolka, Emily Jensen, Jennifer Briggs, Ahn Hyung, Tiffany Watkins, Jesus Caloca, and Helena Nikolai. Jared Hand helped lead the discussion. (Apologies to those of you who attended but I didn’t record your name.)

Had fun playing with the telescope again last night on BSU’s campus.

This time, we observed 55 Cnc, one of very few naked-eye stars that hosts transiting exoplanets. 55 Cnc’s planetary system comprises five fairly large planets, including one twice the size and eight times the mass of Earth in an orbit that roasts its surface at a temperature of 2,360 K — hot enough to vaporize iron.

Below is our image of the sky, annotated by the astrometry.net service (try to ignore the dark doughnut that is probably a dust mote on the telescope). 55 Cnc is the bright star at the bottom and is also called HD 75732.

55 Cnc observed by BSU's campus.

55 Cnc observed by BSU’s campus.

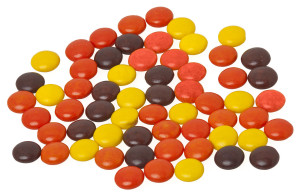
From http://en.wikipedia.org/wiki/Reese%27s_Pieces#/media/File:Reeses-pieces-loose.JPG.

From http://en.wikipedia.org/wiki/Reese%27s_Pieces#/media/File:Reeses-pieces-loose.JPG.

I eat Reese’s pieces almost every day after lunch, and they come in three colors: orange, yellow, and brown.

I’ve wondered for a while whether the three colors occur in equal proportions, so for lunch today, I thought I’d try to infer the occurrence rates using Bayes’ Theorem.

Bayes’ Theorem provides a quantitative way to update your estimate of the probability for some event, given some new information. In math, the theorem looks like

$latex P\left( H | E \right) = \dfrac{ P\left( E | H \right) P\left( H \right)}{P\left( E \right)},$

The probability for event $latex H$ to happen, given that some condition $latex E$ is met, is the probability that $latex E$ is met, given that $latex H$ happened, times the probability for $latex H$ to happen at all, and divided by the probability for $latex E$ to be met at all.

The $latex P(H)$ and $latex P(E)$ are called the “priors” and often represent your initial estimates for the probability that $latex H$ and $latex E$ occur. $latex P\left(E | H \right)$ is called the “likelihood”, and $latex P(H | E)$ is the “posterior”, the thing we know AFTER $latex E$ is satisfied. $latex P(H | E)$ is usually the thing we’re trying to calculate.
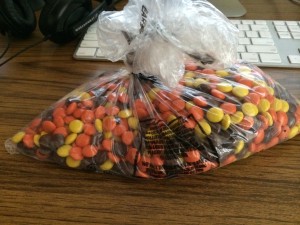
Big bag

Thanks, Winco buy-in-bulk!

So for my case, $latex P(H)$ will be the frequency with which a certain color occurs, and $latex E$ will be my experimental data.

For a given frequency $latex f_{\rm orange}$ of oranges (or browns or yellows), the probability $latex P(f_{\rm orange} | E)$ that I draw $latex N_{\rm orange}$ oranges is  ~ f^N (1 –  f)^N(not orange). As I select more and more candies, I can keep re-evaluating $latex P$ for the whole allowed range of f (0 to 1) and find the value that maximizes $latex P$.

Closing my eyes, I pulled ten different candies out of the bag, with following results in sequence: brown, orange, orange, yellow, orange, orange, orange, brown, orange, yellow, orange. These results obviously suggest orange has a higher frequency than yellow or brown.

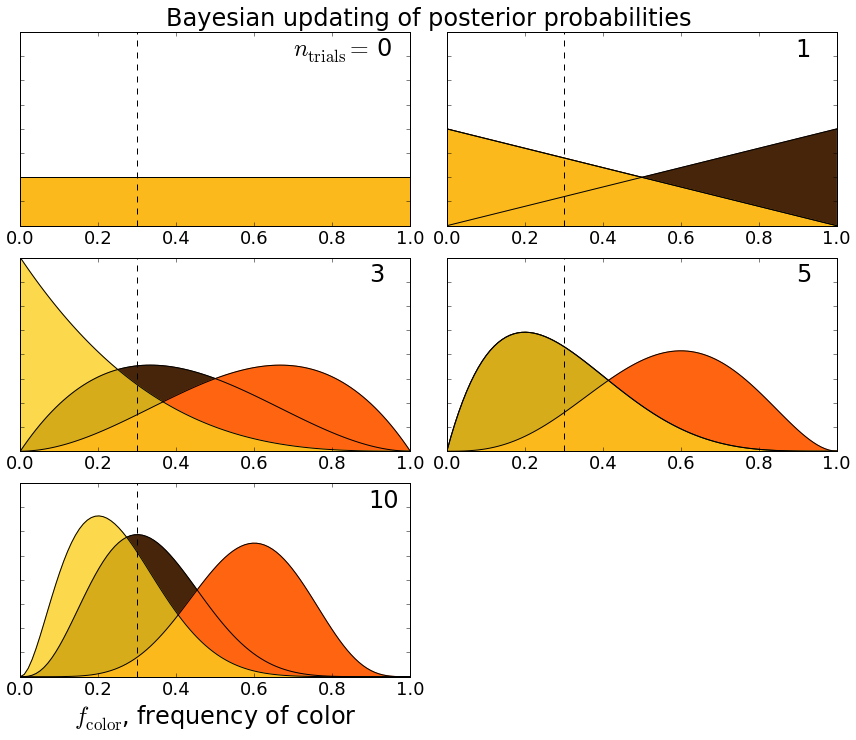
This ipython notebook implements the calculation I described, and the plots below show how $latex P$ changes after a certain number of trials $latex n_{\rm trials}$:
Applying Bayesian inference to determine the frequency of Reese's pieces colors.

Applying Bayesian inference to determine the frequency of Reese’s pieces colors.

So, for example, before I did any trials $latex n_{\rm trials} = 0$, I assumed all colors were equally likely. After the first trial when I chose a brown candy, the probability that brown has a higher frequency than the other colors goes up. After three trials (brown, orange, orange), orange takes the lead, and since I hadn’t seen any yellows, there’s a non-zero probability that yellow’s frequency is actually zero. We can see how the probabilities settle down after ten trials.

Based on this admittedly simple experiment, it seems that oranges have a frequency about twice that of yellows and browns. Although not as much fun, if I’d bothered to check wikipedia, I would have seen that “The goal color distribution is 50% orange, 25% brown, and 25% yellow” — totally consistent with my estimate.

Artist's impression of Kepler-22b as an oceanic "super-Earth" within its star's habitable zone. From http://en.wikipedia.org/wiki/List_of_potentially_habitable_exoplanets.

Artist’s impression of Kepler-22b as an oceanic “super-Earth” within its star’s habitable zone. From http://en.wikipedia.org/wiki/List_of_potentially_habitable_exoplanets.

At Friday’s journal club, we discussed a recent paper from Montet et al. (2015) that follows up on discovery of planetary candidates observed by the K2 Mission from Foreman-Mackey and colleagues.

Montet and colleagues combined high-spatial resolution and ground-based spectral observations, along with re-analysis of the K2 data, to confirm or refute the planetary status of earlier discoveries. They were able to validate 18 of the original 36 as planets, including a sub-Neptune planet, EPIC 201912552, orbiting a relatively bright M-dwarf star.

As Montet et al. point out, this object is a great candidate for follow-up observations. In fact, it looks like we could see it from Boise State’s Challis Observatory.

Friday’s attendees included Jennifer Briggs, Nathan Grigsby, Catherine Hartman, Tanier Jaramillo, Emily Jensen, and Liz Kandziolka.

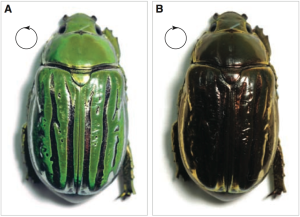
Coloration of a jeweled beetle in light with left (a) and right (b) circular polarization. From Sharma et al. Science 325, 449 (2009).

Coloration of a jeweled beetle in light with left-handed (a) and right-handed (b) circular polarization. From Sharma et al. Science 325, 449 (2009).

Fascinating talk this morning from Prof. Srinivasarao of Ga Tech in the Material Sciences and Engineering Seminar about the physics of animal coloration.

Turns out the brilliant and iridescent coloration displayed by many insects and other animals is not due to dyes or pigments. Rather it’s due to micro- and nano-scale structures in animals’ scales or exoskeletons. These small structures combine polarization, reflection, and other subtle light manipulations to produce their complex and dazzling color displays.

Prof. Srinivasarao studies these processes and how we can replicate them in his lab. Here’s a recent publication from his lab.